Motivation for PacVis
I must admit that I love Arch Linux, largely because Arch Linux made me feel like I really own the whole system. In my Arch Linux system, I know clearly every package I have installed and why I installed it. I can find which package brings in a give file. A Debian/Fedora/openSUSE user with enough experience may achieve this with their favorite package manager too, but they must overcome a much higher complexity with their distro's fine-grinding packaging strategy. Usually they have 3 to 10 times more packages than Arch Linux on a similar setup. And with regard to packaging system, they must work with much more details than Arch's simple PKGBUILD based packaging.
Every user who successfully installed Arch Linux should have learned that, after
the initial installation, you will only get a minimum setup. The most important
step in the installation guide on ArchWiki is a command
pactrap /mnt base
, which will use
/mnt
as the filesystem root
and call
pacman -S base
inside that root to install the whole base
group. And that's basically all you will get after the install. The initial
system has nearly nothing. Everything you need will be installed afterwards,
manually by using
pacman
. It is nothing unnecessary, only for
your own need.
But after using the system for a long time, there are unavoidably some packages
inside the system which are installed and used for awhile and abandoned.
They are like the old furnitures inside your house, taking space and covered by
dusts. We have
pacman -Qtd
to help you find all orphan packages, namely
those installed as dependency for other packages once but not needed for now
, but for manually installed packages, we have no good tool but manually
checking them one by one.
So I was looking for a tool to help me understand the relations in my system. In particular, I want a tool to help me do these things:
- Find packages that I installed manually but not needed now
- Find those large and space-consuming packages
- Understand the relationships between packages
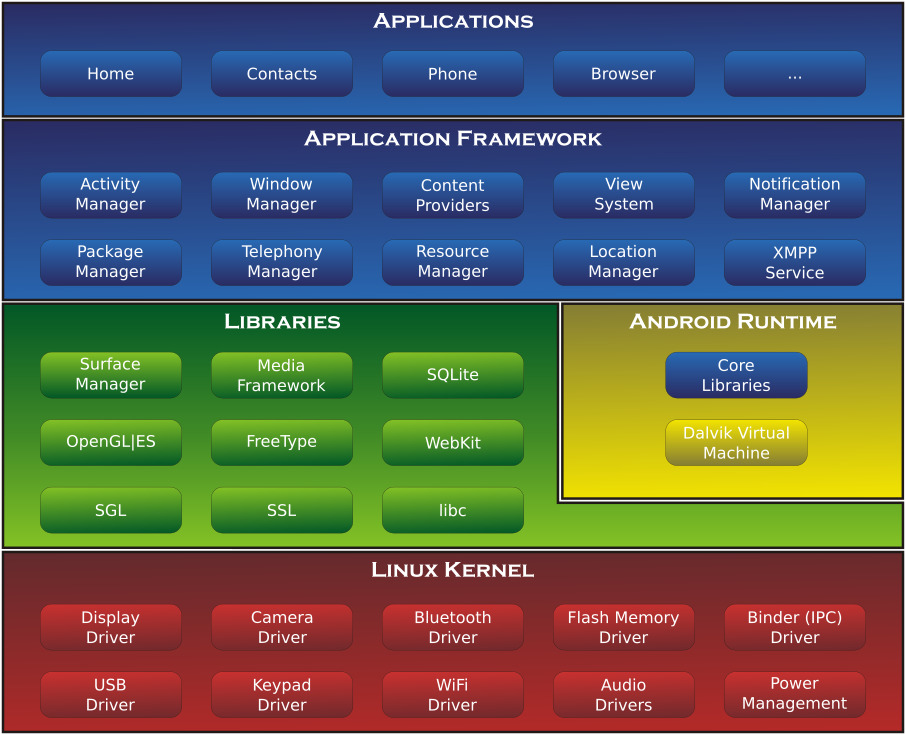
About the last thing "relations between packages", I once saw the diagram of macOS Architecture and Android System Architecture, and I was impressed by the layered hierarchy in these diagrams. I was wondering since then, is it possible to draw a similar layered architecture diagram for modern Linux desktop ? Or will a Linux desktop be much different? I can find out hierarchy diagrams for Linux kernel or Xorg graphic stack on Wikipedia or other sites, but I don't know such diagrams for the whole distribution. And further I thought, can I draw such diagram from the dependency relationships between packages automatically?
Predecessors of PacVis
Before working on PacVis, I have tried several similar tools. Some of them meet some of my needs, but they all lack certain features that I considered important. These tools became the prototype of PacVis, as they enlightened me of how PacVis should be.
pactree
pactree started as an individual project
, but now it is part of pacman.
From its manpage we can see that the output of pactree is a dependency tree
starting from a given package. By appending
--graph
parameter, pactree
can also output a diagram in dot format,
then we can render this diagram using dot command:
pactree pacvis-git -d3 --graph | dot -Tpng >pacvis-pactree.png
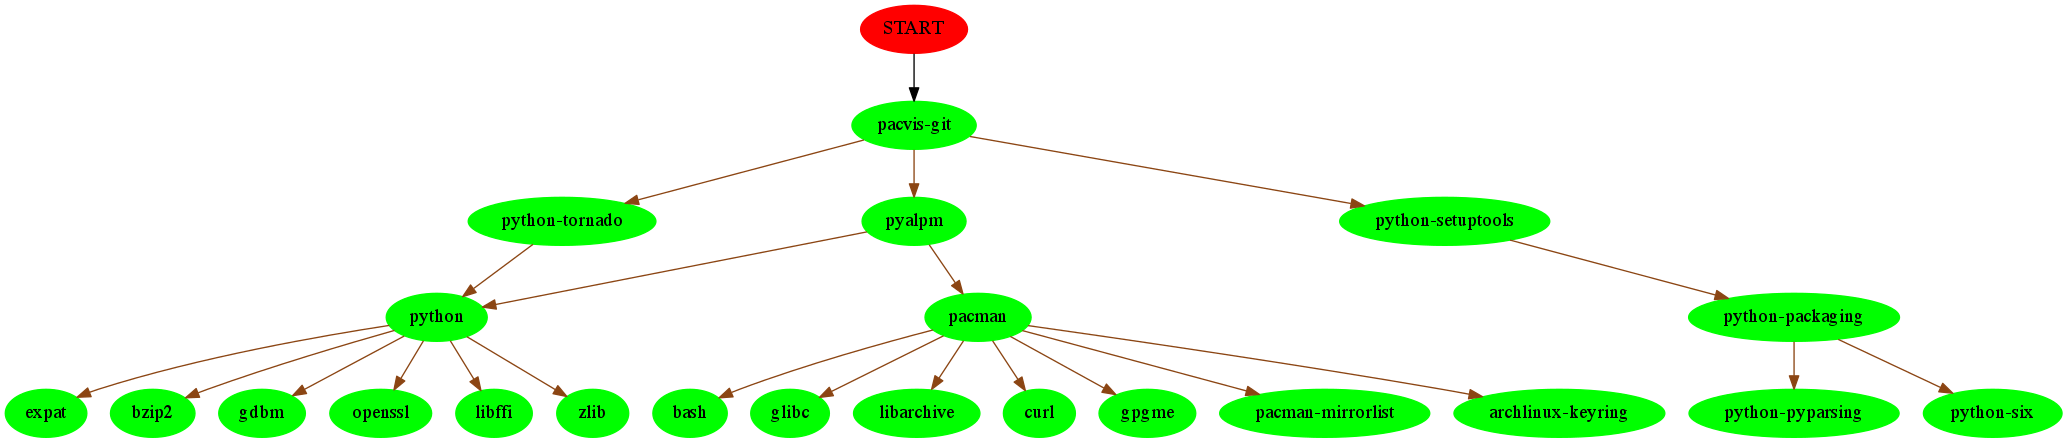
$ pactree pacvis-git -d3
pacvis-git
├─python-tornado
│ └─python
│   ├─expat
│   ├─bzip2
│   ├─gdbm
│   ├─openssl
│   ├─libffi
│   └─zlib
├─pyalpm
│ ├─python
│ └─pacman
│   ├─bash
│   ├─glibc
│   ├─libarchive
│   ├─curl
│   ├─gpgme
│   ├─pacman-mirrorlist
│   └─archlinux-keyring
└─python-setuptools
  └─python-packaging
    ├─python-pyparsing
    └─python-six
 $ pactree pacvis-git -d3 --graph | dot -Tpng >pacvis-pactree.png
From the rendered diagram we can see that, because some packages may share common dependencies, the whole diagram is no longer a tree in graph theory . During the initial prototyping of PacVis, I tried to parse the output of pactree and pacman using bash/python scripts, to draw a single diagram for the whole system. However the rendered picture is so large that it takes hours for dot to layout them, and the result is barely viewable in an image viewer or a browser.
I need to say that there will be no PacVis if there is no pactree. Even the pyalpm library that I used in PacVis is a python binding for alpm, which is born during the rewrite of pactree in C language.
pacgraph
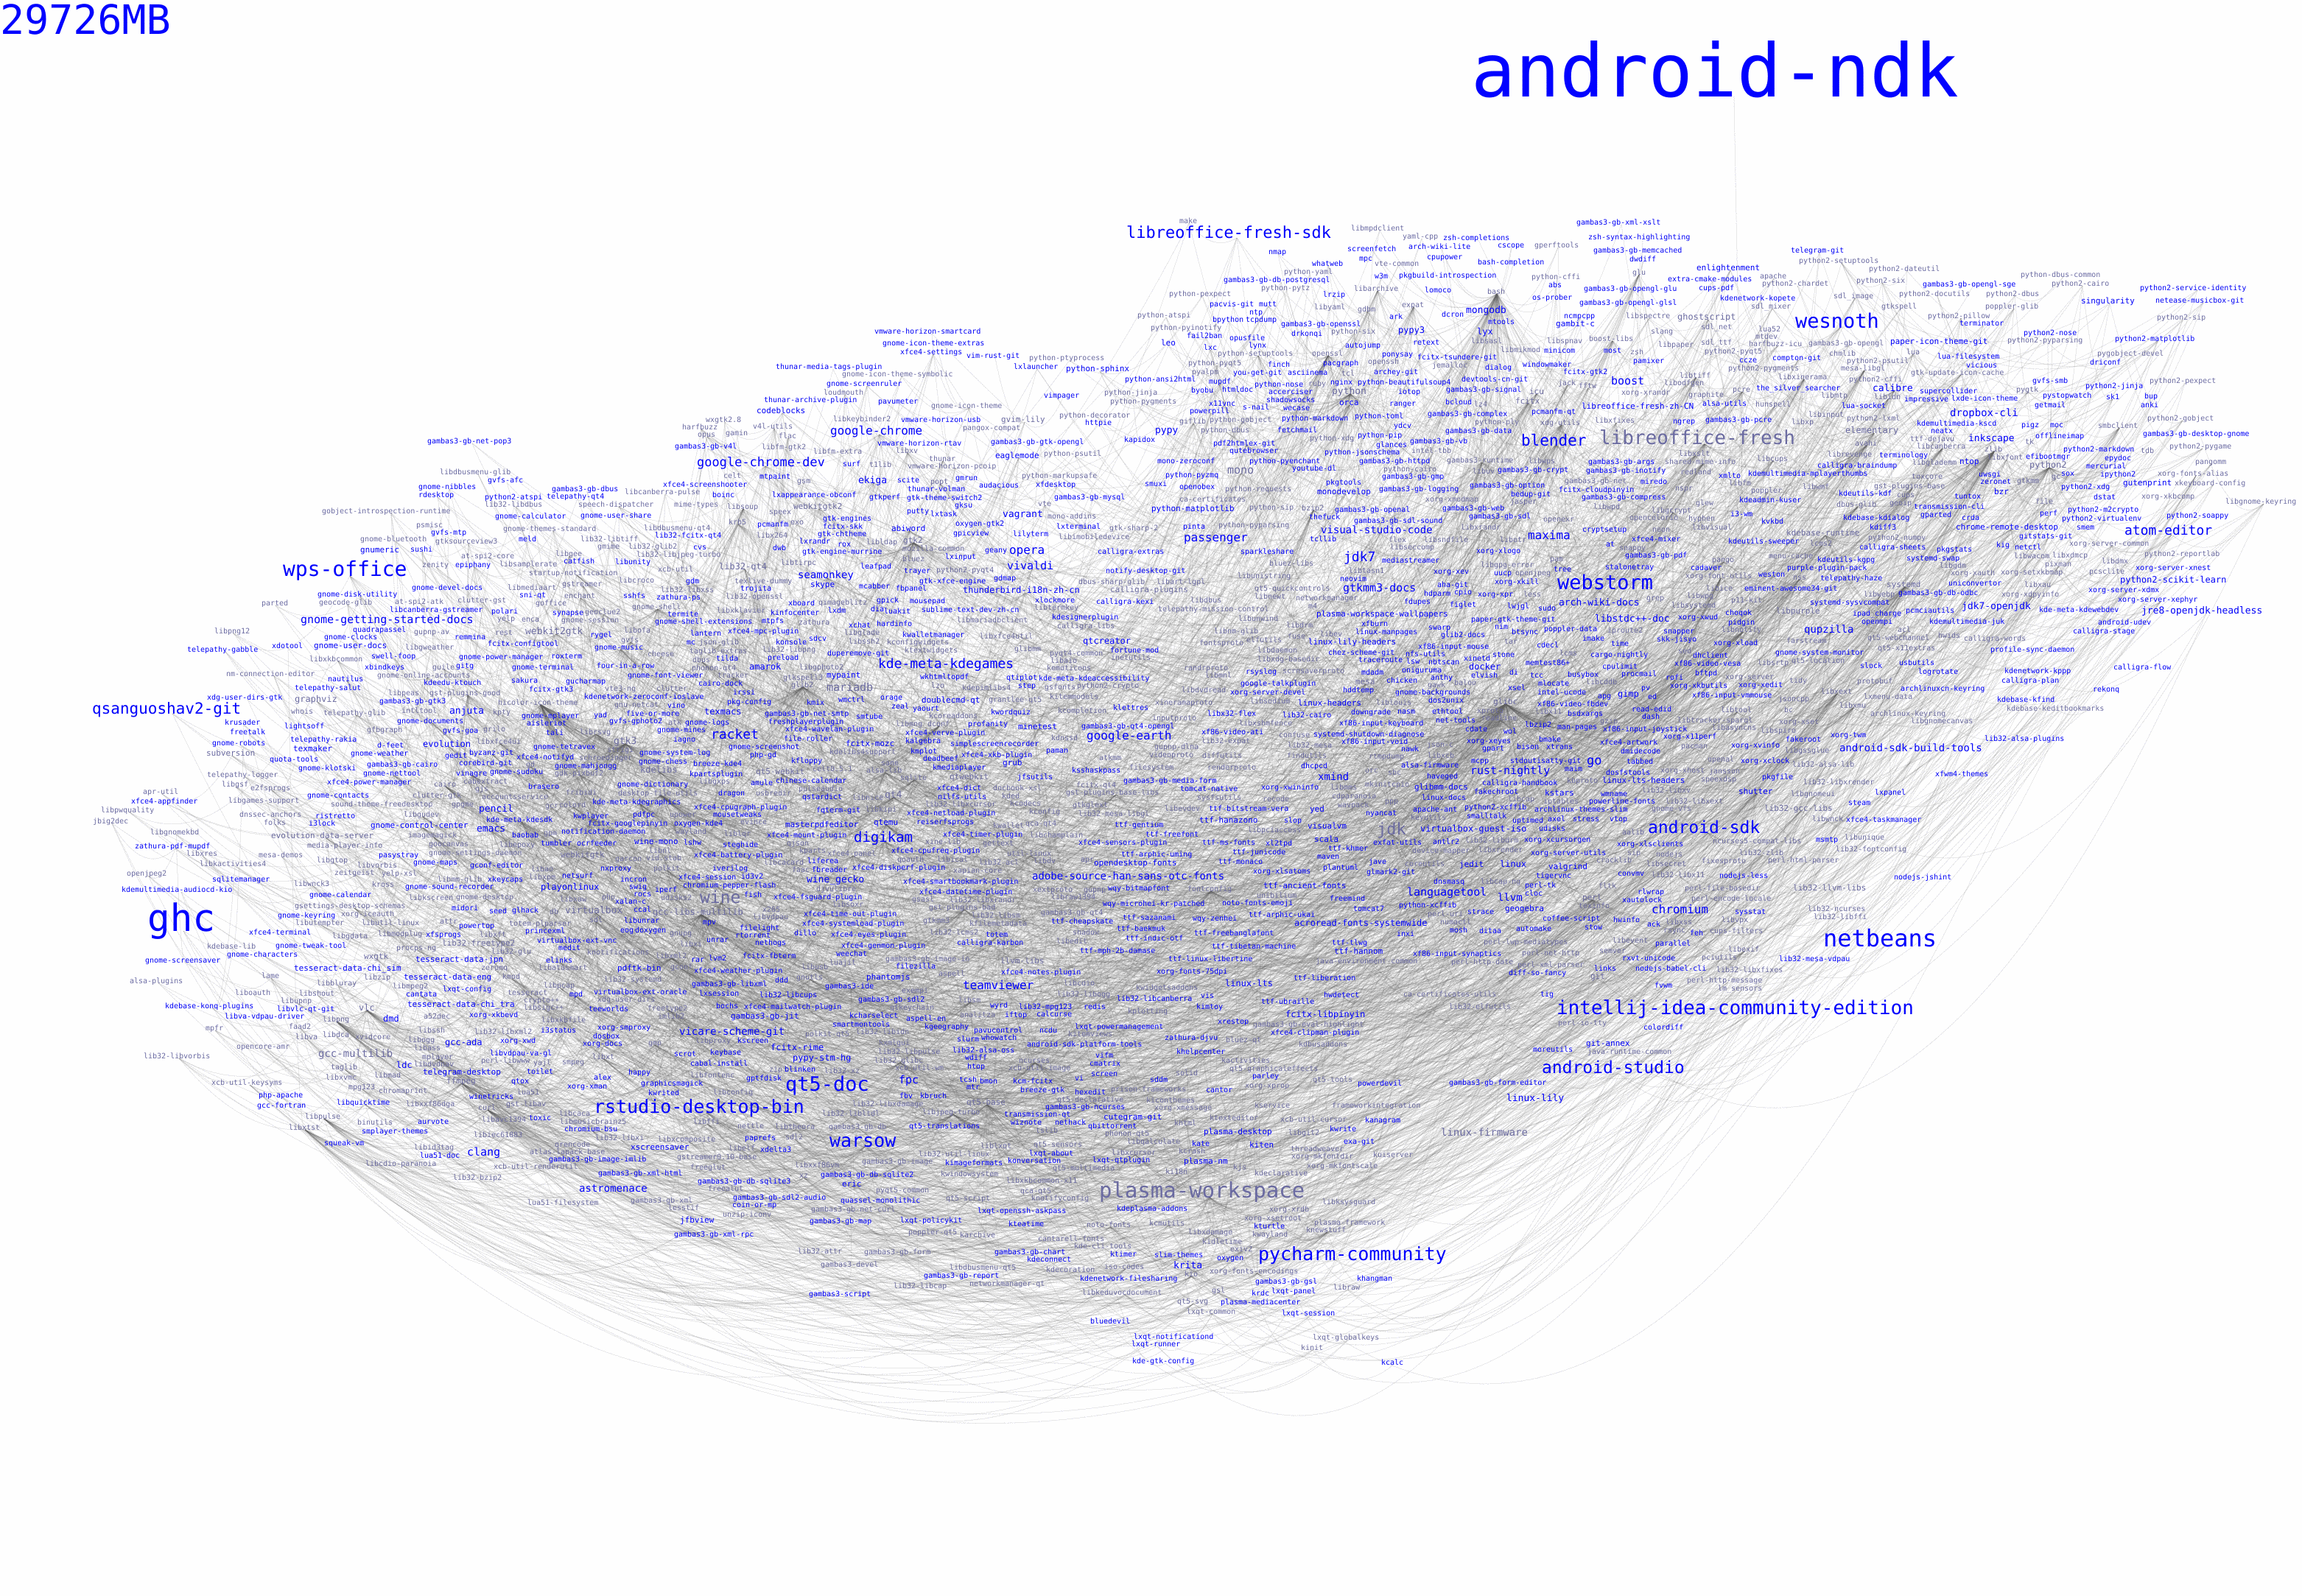
pacgraph is developped by a Arch Linux Trusted User keenerd . It is written in Python, as is PacVis. Comparing with pactree, pacgraph is definitely more suitable for my needs. It will draw a diagram for all the packages in the system, using a clever layout algorithm that surpass the performance of dot's layout.
The output of pacgraph is an artistic diagram with different font size of package names showing their disk usage. By viewing pacgraph's output, we can determine the overall system structure, e.g. whether the system is a desktop system or a server. We can easily find large packages and consider remove them.
There's more. pacgraph provided an interactive GUI called pacgraph-tk, written clearly in tk. You can zoom in to see details or zoom out to see the whole graph in GUI, and you can highlight one package to see its relations to others.
And pacgraph support to render the dependencies of a selected group of packages, not all, like pactree does.
But pacgraph does not meet all my needs. I want a diagram to show the architecture of the system, but pacgraph don't differ "the packages that this package depend on" and "the packages that depends on this package". In other words, pacgraph draws a undirected graph, but I want a directed graph, that reflects the layered hierarchy of dependency relationship.
So here is PacVis
With these predecessors, I started working on PacVis. The development takes me 2 month, and largely break into 2 stages. In the first stage I wrote basic logics and a prototype of the UI. In the second stage I applied the templates from https://getmdl.io/ . Now finally it is usable for others.
So several days ago I made a PKGBUILD for pacvis on AUR: pacvis-git. Now it's fairly easy to run pacvis locally on a Arch Linux system. You can use any aurhelper you familiar with, or build it directly from AUR:
~$ git clone [email protected]:pacvis-git.git
~$ cd pacvis-git
~/pacvis-git$ makepkg -si
~/pacvis-git$ pacvis
Start PacVis at http://localhost:8888/
Following the instruction, open http://localhost:8888/ in a browser then you can see PacVis's result of your own system. As a demonstration you can also visit PacVis on my Arch Linux server : https://pacvis.farseerfc.me/ . It is showing a minimal server setup, that might load and layout faster than a normal desktop system.
As a side note, pacvis only depends on pyalpm and tornado, so there should be no problem running it on other pacman-based systems, including msys2 on Windows (altough building a msys2 python-tornado may take some non-trival effort).
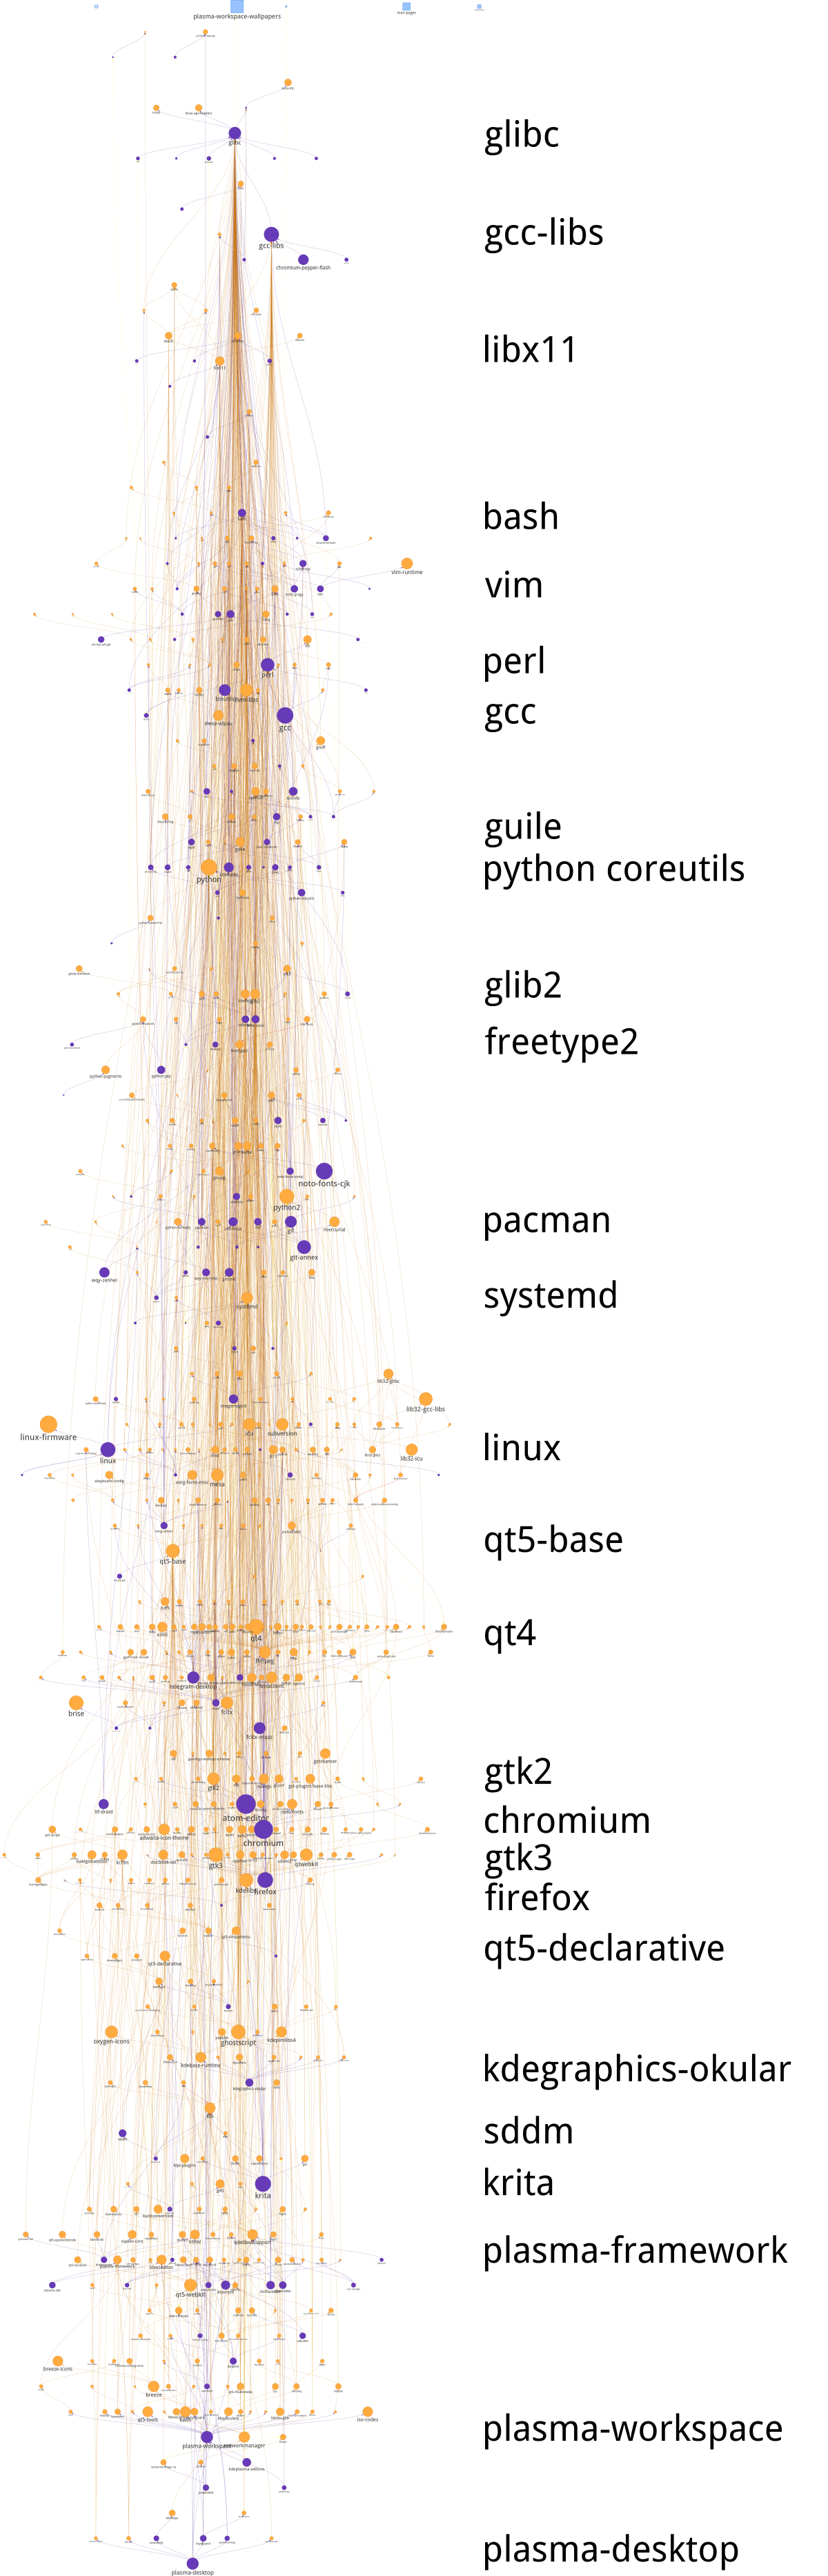
The legend and usage of PacVis
PacVis resembles the UI of a map app such as Google Maps. You can use wheel of mouse to zoom and drag to move, or pinch gestures on a touch screen. There is a side panel on the right top corner and you can hide it when you don't need it. There are some zoom buttons on the right bottom corner.
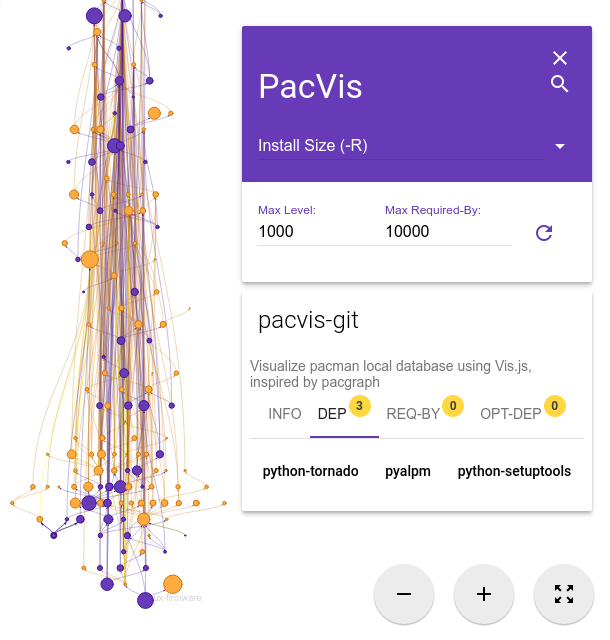
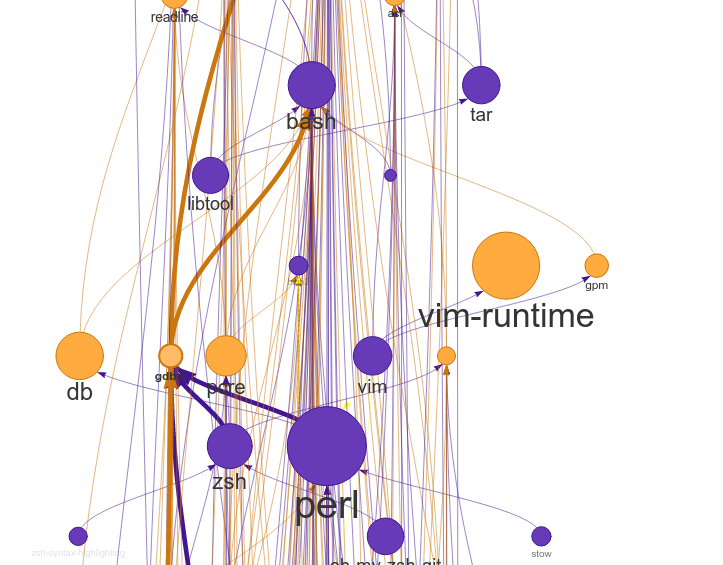
The dependencies of pacvis-git package
The whole diagram is made up of small circles and arrows in between circles. A circle represent a package, while an arrow represents a dependency relationship. If you zoom into details, you can see text under the circles showing their package names. Hover on packages will also give you infos about the package. You can select a package, and in the side panel there will be more detailed infomation about that package.
The above picture is showing the dependencies of pacvis-git package itself. It dependes on pyalpm, python-tornado and python-setuptools, while pyalpm is in-turn depend on pacman. A package in purple means it is installed manually, while a package in orange means it is installed as a dependency for other packages. The color of arrows usually follow their origin package's color.
Note that most arrows in the diagram are pointing bottom-up, this is because PacVis will do a topology sort based on the dependencies of packages. From the topology sort, PacVis assigned a topology level to each package, e.g. pacvis-git has a topo-level of 39, its dependency pyalpm has a topo-level of 38, and pacman is sat on the topo-level 37. Layering packages with their topo-level is the main difference of PacVis with pacgraph.
Besides manually zoom-in to look around, you can also use PacVis's search box to locate a particular package by its name. And when you select a package, the related package names will be shown in the Dep and Req-By tabs in the sidebar. These package names are made as buttons so you can click them to browse the whole dependency graph.
Let me describe some arguments related to the implementation:
This will limit the max topo-level that PacVis renders. When there are too many packages, the layout algorithm will take a lot of time. Limiting this is very useful during debug of PacVis.
This will limit the max required-by-relationship that PacVis renders. If you play around in PacVis, you will soon find that most packages in the system directly depends on glibc or gcc-libs. Rendering these well-known dependency may result in a lot of long arrows, that reduce the readability of the whole diagram. You can limit this to a lower number so that PacVis will not render these well-known dependencies.
Some facts you can learn from PacVis
You may find many facts by playing around in PacVis. An example will be the aforementioned "most packages depends on glibc". Besides that, I will give some more examples below.
Dependency hierachy
The packages in the system is clearly divided into several layers:
- glibc, etc. C runtime
- Bash/Perl/Python etc. script languages
- coreutils/gcc/binutils etc. core binary utilities
- pacman/systemd etc. large system utilities
- gtk{2,3}/qt{4,5} etc. GUI toolkit
- chromium etc. GUI Applications
- Plasma/Gnome etc. Desktop environments
This largely meet my overall understanding, but some details are interesting to me. For example, zsh dependes on gdbm which in-turn depends on bash, which means that you can not get rid of bash even if you only use zsh. For another example, python package (which is python3 in Arch Linux) and python2 and pypy sit roughly on the same topo-level in the diagram.
zsh indirectly depends on bash because of gdbm
However there are some facts beyond common knowledge, e.g. qt5-base < qt4 < gtk2 < gtk3 with regard to topo-level. Qt5 was split into several packages therefore it is understandable that qt5-base is lower than qt4. The fact that gtk is more high level than qt may beyond most expectations (including mine).
Circular dependencies
There are some packages that have circular dependencies in between. An example will be freetype2 and harfbuzz. freetype2 is a library for font rendering, and harfbuzz is a library to deal with OpenType font shapes. They depend on each other. Another example is kio and kinit of KDE. kio provides VFS-like and FUSE-like resource abstraction for KDE applications, while kinit is in charge of initializing KDE desktop environment.
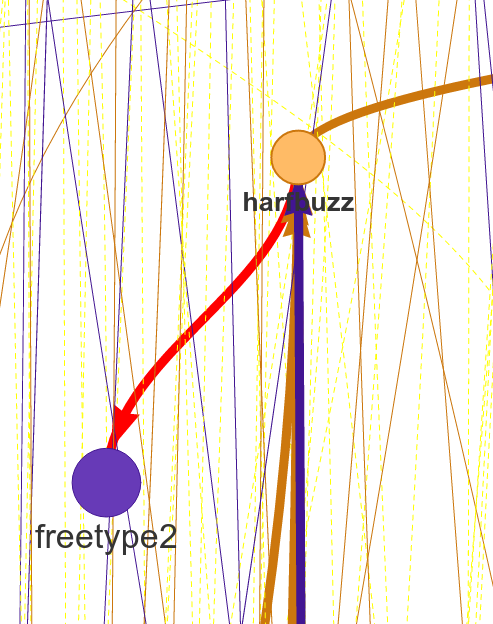
Circular dependency between freetype2 and harfbuzz
Because of these circular dependencies, PacVis cannot simply apply topology sort directly. Before that, PacVis will firstly find all circles in the dependency graph to break these circles. It renders the relationship that will cause a circle as red arrows in the diagram.
Some packages don't have dependency relationship
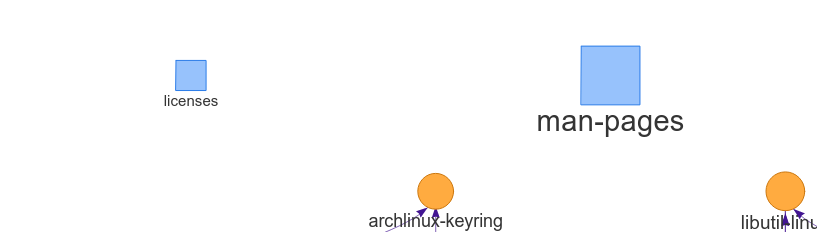
man-pages and licenses don't have dependencies
There are some packages that don't depend on others, and don't depended by others. They are isolated in the whole diagram, e.g. man-pages and licenses. These packages sit on the most top level of the diagram, with a topo-level of 0. PacVis will render them as blue squares specially.
Linux (the kernel) is unimportant, if we only look at dependencies
All userspace program depend on glibc, which calls the kernel using well-defined syscalls. As a result, if we only look at userspace dependencies, glibc and other GNU components are the center of the GNU/Linux distribution, while Linux the kernel is just located in a random place deeply blew the dependency graph. On my demo server the Linux package is even located on the most bottom level because it depends on mkinitcpio which in-turn depend on many components in the system.
pacman -Qtd cannot find orphan packages with circle dependency
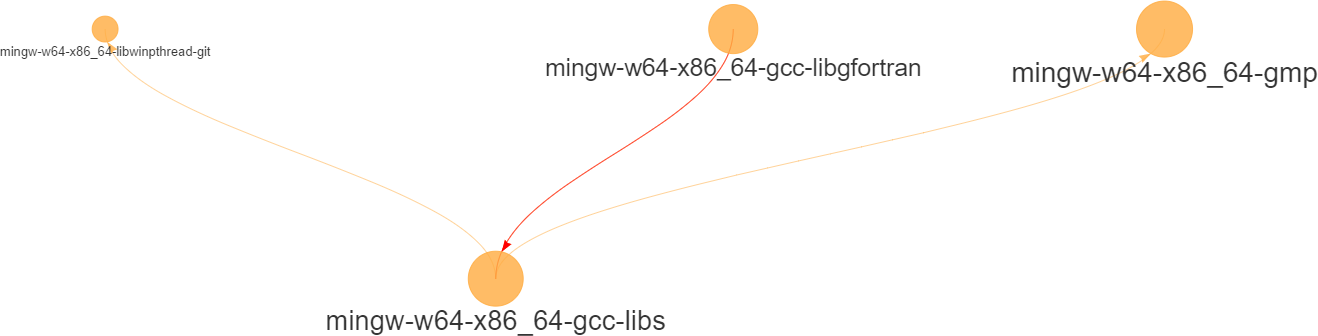
msys2 packages with circle dependency
I saw an archipelago of packages from mingw repo when testing PacVis on msys2.
To my surprise, they don't connected to any manually installed packages,
something strange as I routinely run
pacman -Qtd
and remove the results on
all my systems. After zoomed in I found that they contained a circle dependency
which indicated
pacman -Qtd
cannot find these orphan packages,
not like a GC algorithm.
The future of PacVis
Currently PacVis is what I planned to make, with some features added during the development. Some of these added features are related to the poor performance of the layout algorithm (e.g. limiting the max level).
In the future I planned to add more features:
- More reasonable behavior for optdeps. Currently PacVis draw optdeps but do not consider it during the topology sort.
- More reasonable dependency resolution. Sometimes the dependency is not
written directly as package names, instead they appear in
providesarray in the metadata. Currently PacVis resolve all dependencies using alpm directly, which will lose these information. - Currently PacVis did not consider the repository (core/extra/community) and package group that a package belongs to. In the future PacVis may consider these infomation to render a clearer hierarchy.
- Currently PacVis cannot show only part of the packages. In the future we may provide the ability to draw only a part of all the installed packages like pactree/pacgraph does.
If you want some features in PacVis, please leave me an issue .
Github Issue comments
Disqus comments